Useful Resources to Understand Data Visualization
A list of useful resources to understand data visualization:
* The Data Visualisation Catalogue
* Datawrapper Academy Training material
* Flourish Studio Chart Guides
* Tableau: Visual Analytics - Families, Types, and Importance
* How to create effective charts and diagrams
The first step is to focus on your purpose. What do you want to show?
- Comparison
- Distribution
- Composition
- Relationship

framework by Dr. Andrew Abela to choose chart types
* How the data should be interpreted decides the type of chart to be used - 72 types of data visualization explored
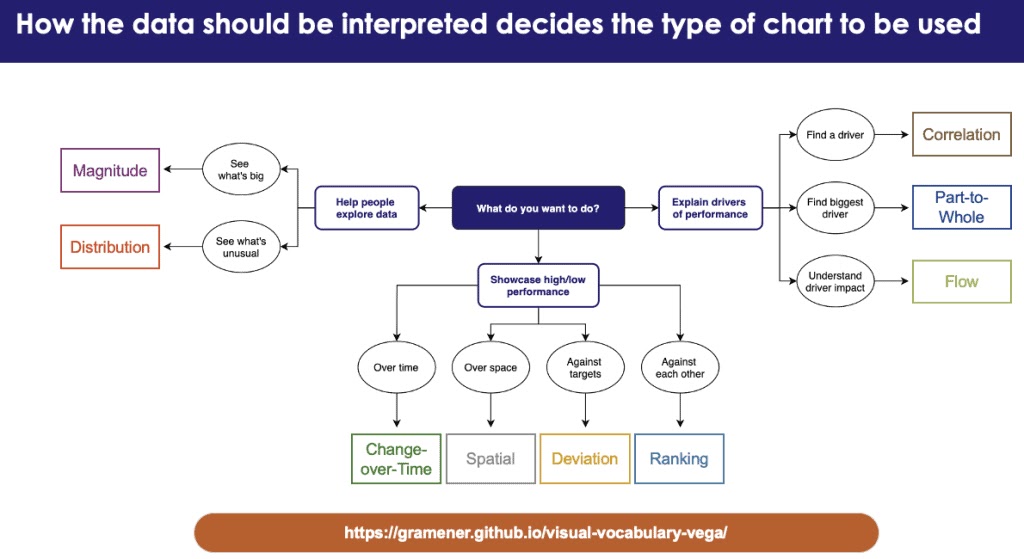
a perspective by Gramener
* 10 Useful Ways to Visualize Your Data (With Examples) [PDF]
* Data visualization 'chart chooser' quick-reference guide [PDF] by Prof. Steve Franconeri
* VizDex - a library of personal and independent blogs and newsletters dedicated to data visualization.
For real life examples check the data journalism sections from India and around the world in newspapers & other publications -
* Voronoi
Studying these publications helps analysts learn how to:
- identify interesting questions rather than merely producing reports;
- choose the right visualization instead of the most complicated one;
- provide context, comparisons, and historical trends;
- explain uncertainty and methodology clearly; and
- communicate findings to non-technical audiences.
W.I.P.


Comments
Post a Comment