Data Literacy Foundations course by Maven Analytics
As with the other Maven Analytics courses I have taken, the Data Literacy Foundations course offers a downloadable presentation deck for future reference and this one also had quizzes which I found very useful.
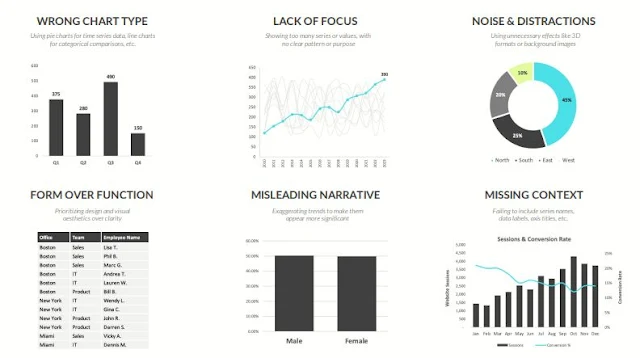
I especially liked how the instructor explained anti-patterns and how to progressively improve building a dashboard. |
| Mistakes Fixed |
Key points from the 180-minute course:
Data is one of the most valuable assets a business can own, but data literacy is what brings it to life
Data literacy is about translating raw data into meaningful information, and using that information to inform data-driven decisions
Data analysis is about identifying actionable insights that can help inform decisions and impact real-world outcomes
The goal of any analysis is to inspire action.
Data democratization describes the process of empowering employees throughout an organization with the access and resources they need to make data-driven decisions.
Data democratization isn’t just about data access, it’s an ongoing process and a cultural shift, to enable people with the skills, tools and resources they need to utilize data responsibly and effectively.
A strong data ecosystem requires strategy, architecture and governance
Profiling and QA help you understand and describe the qualities of a dataset
- What data are you working with?
- What do you want to communicate?
- Who is your audience and what do they need?


Comments
Post a Comment