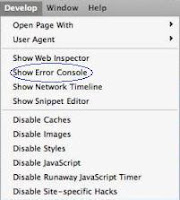
HOW TO debug Javascript in Safari 3.1 on Windows

If you are targeting your web application for Safari users and also want to make sure your JavaScript code is cross-browser, how can you check for any JavaScript errors on that browser? It can be done by activating the Develop menu (which is disabled by default) and picking the Show Error Console option (similar to Tools menu > Error Console option in Firefox). To enable the Develop menu in the Menu bar, select Edit > Preferences and check the "Develop menu in menu bar" option in the Advanced tab. As Safari for Windows and the iPhone’s mobile Safari use the WebKit engine , this browser debugging technique could be of use to developers testing ASP.NET applications for the iPhone on Safari for Windows . Web Inspector is the Safari equivalent of Firebug FireFox Add-On & IE Developer Toolbar The Show Network Timeline option shows the transfer time for each component of a downloaded web page. Related links: HOW TO make web pages "cross browser" HOW TO easily...


