IE8 Developer Tools Tips & Tricks - #4: Edit CSS Visually
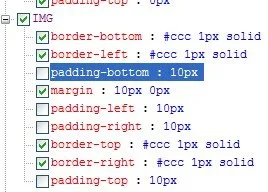
Debugging CSS in an inherited web application or trying to adapt CSS from an inspiring design of someone's website is generally not an easy task. One of the interesting features in IE 8 Developer Tools is the facility to edit CSS visually.

- After you open the desired web page of which you want to debug CSS, open Developer Tools from the menu or using the keyboard shortcut F12.
- Click on the CSS tab.
- If you already know the Class and ID information, select it from the treeview of all Class and ID style definitions for the corresponding web page otherwise go to the View menu in Developer Tools and select Class and ID information. On choosing this all the CSS Classes and IDs will be displayed as small labels on the web page that you are debugging CSS for.
- You can see how the attributes of a particular style definition operate by un-checking the checkboxes next to each element's style definition & view the changes immediately in real-time by switching to the web page.


Informative article. Thanks a lot. It seems that IE8 will be a power packed browser.
ReplyDelete